September became the fifth month this year to post a decline in home sales compared to a record-setting 2016, while marking the 71st consecutive month of rising sale prices year-over-year, according to the October RE/MAX National Housing Report. Find the complete...
National Housing Report
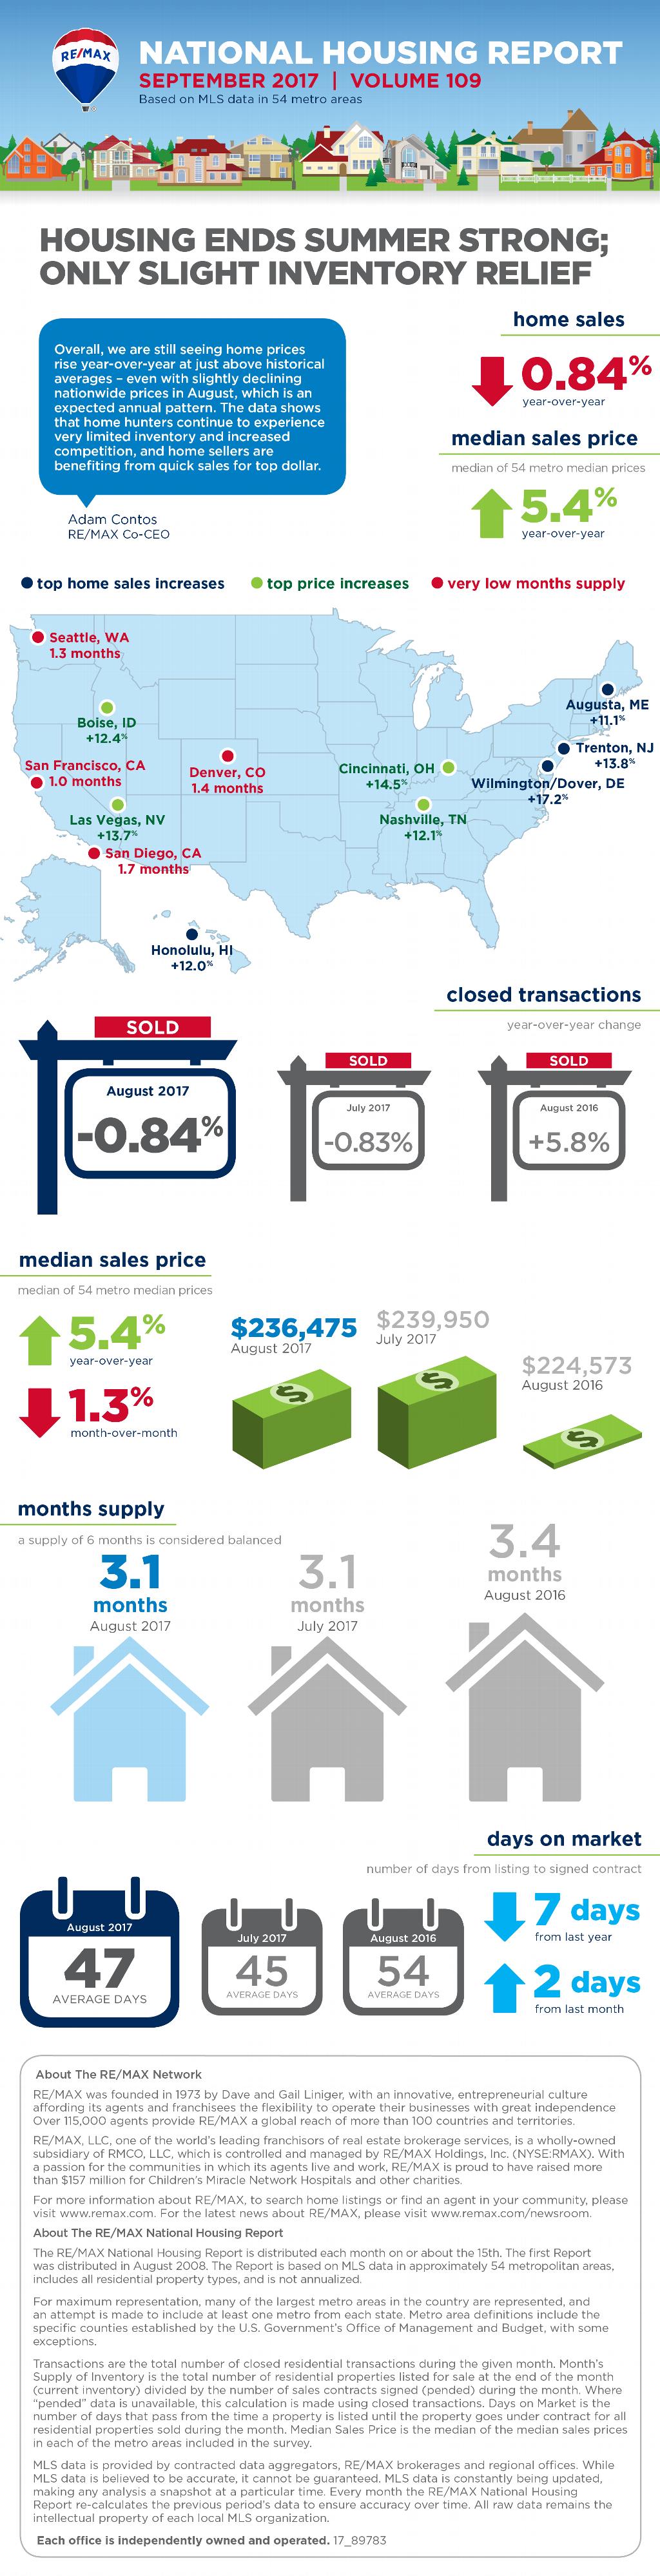
September Housing Report
U.S. home sales in August extended a summer of strong demand and weak inventory that once again resulted in listings with short shelf lives. In addition to the normal late summer real estate trends, a primary focus during the next month will be on housing in specific...
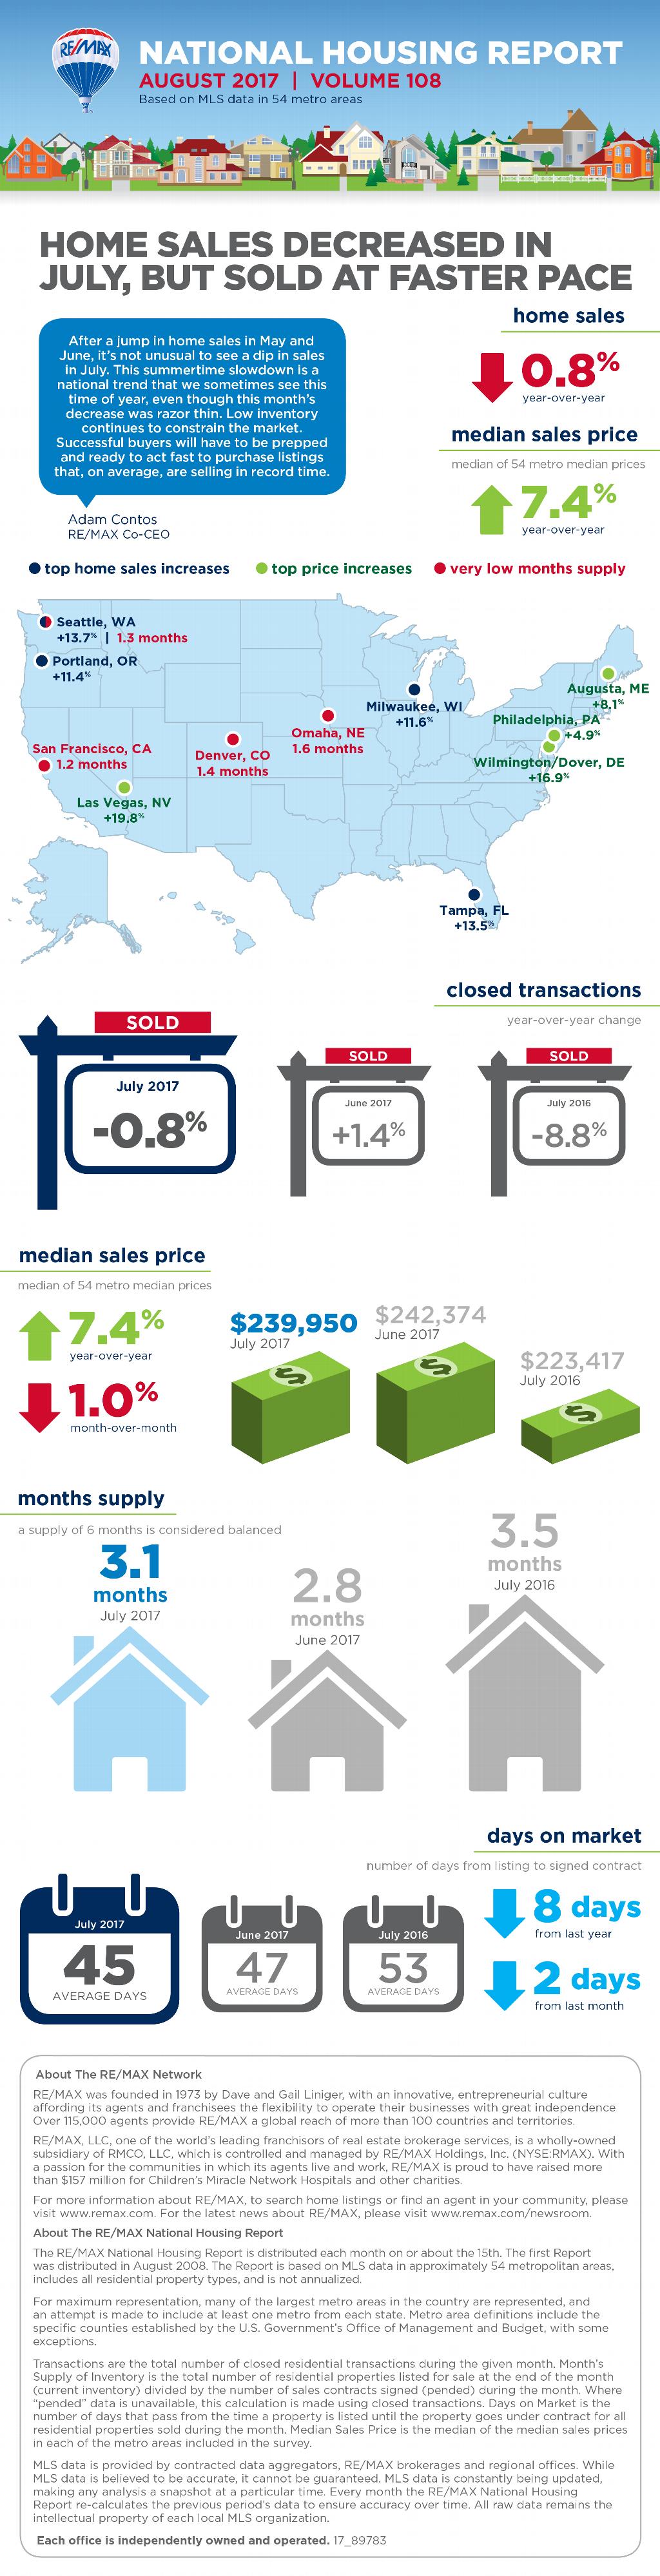
August Housing Report
DENVER – While July home sales decreased slightly, homes sold at a faster rate than any month in nearly a decade, according to the August RE/MAX National Housing Report that analyzes housing data in 54* metro areas. July home sales declined 0.8% year-over-year, and...
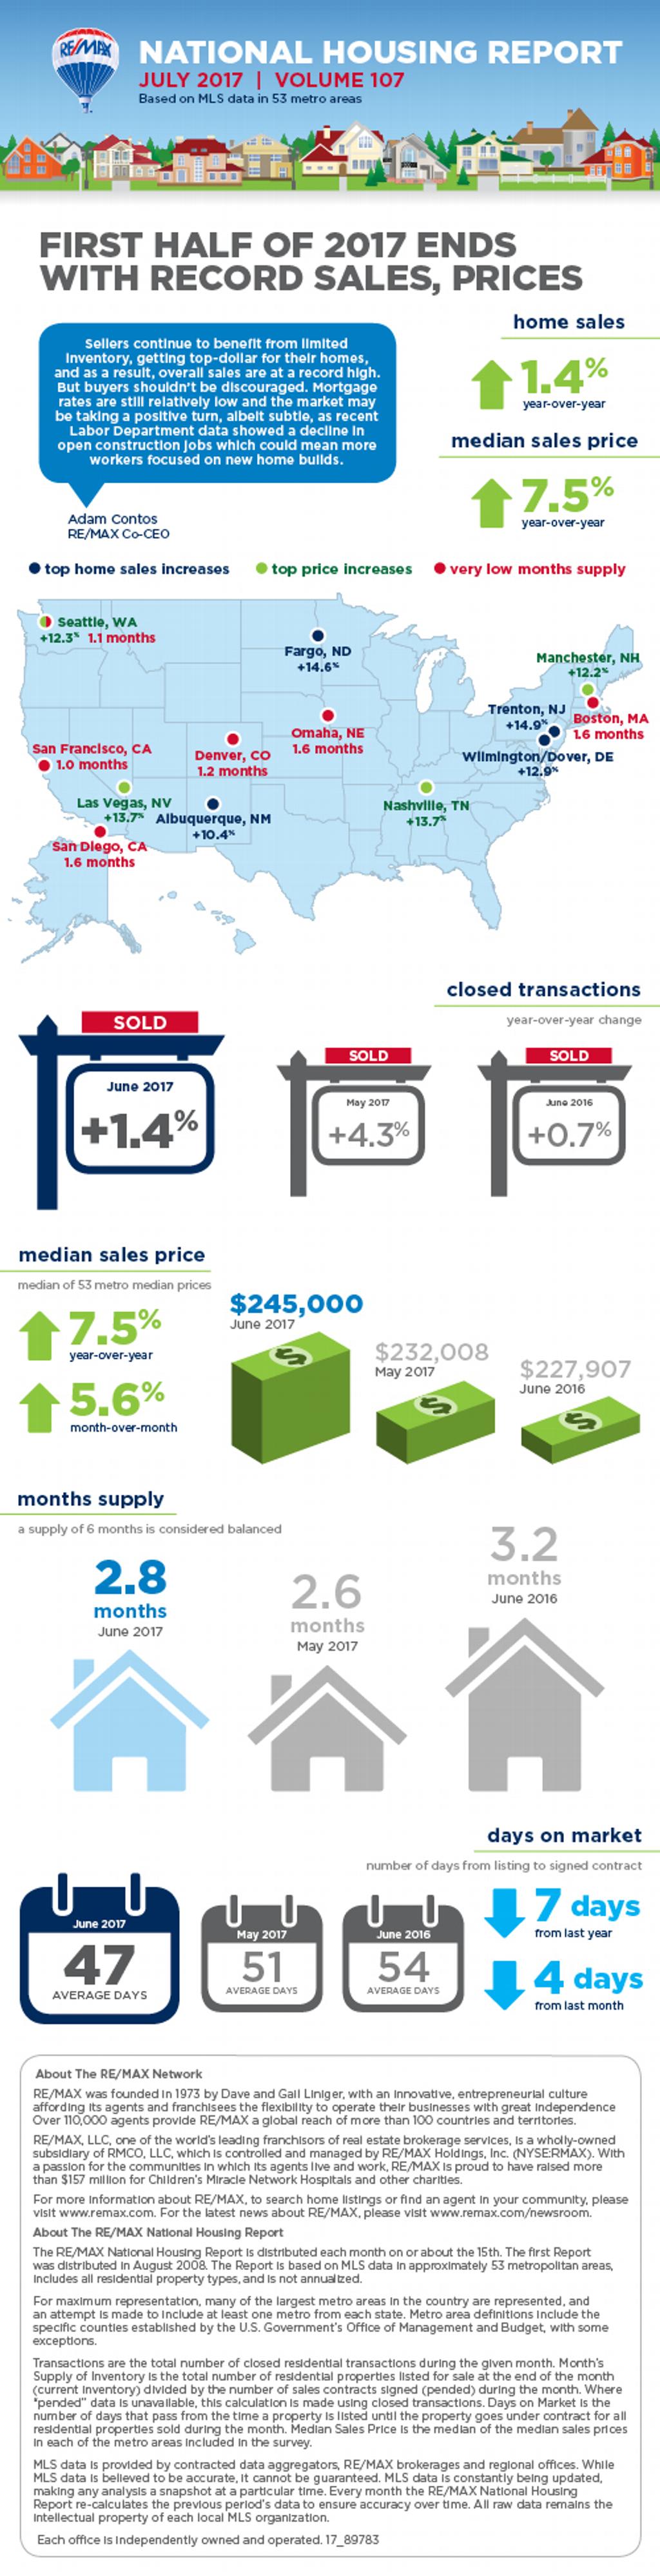
July Housing Report
DENVER – Halfway through 2017, the U.S. housing market is on pace for another record year as four of the last six months have topped same month sales from 2016, according to the July 2017 RE/MAX National Housing Report. June home sales were 1.4% higher than June 2016,...
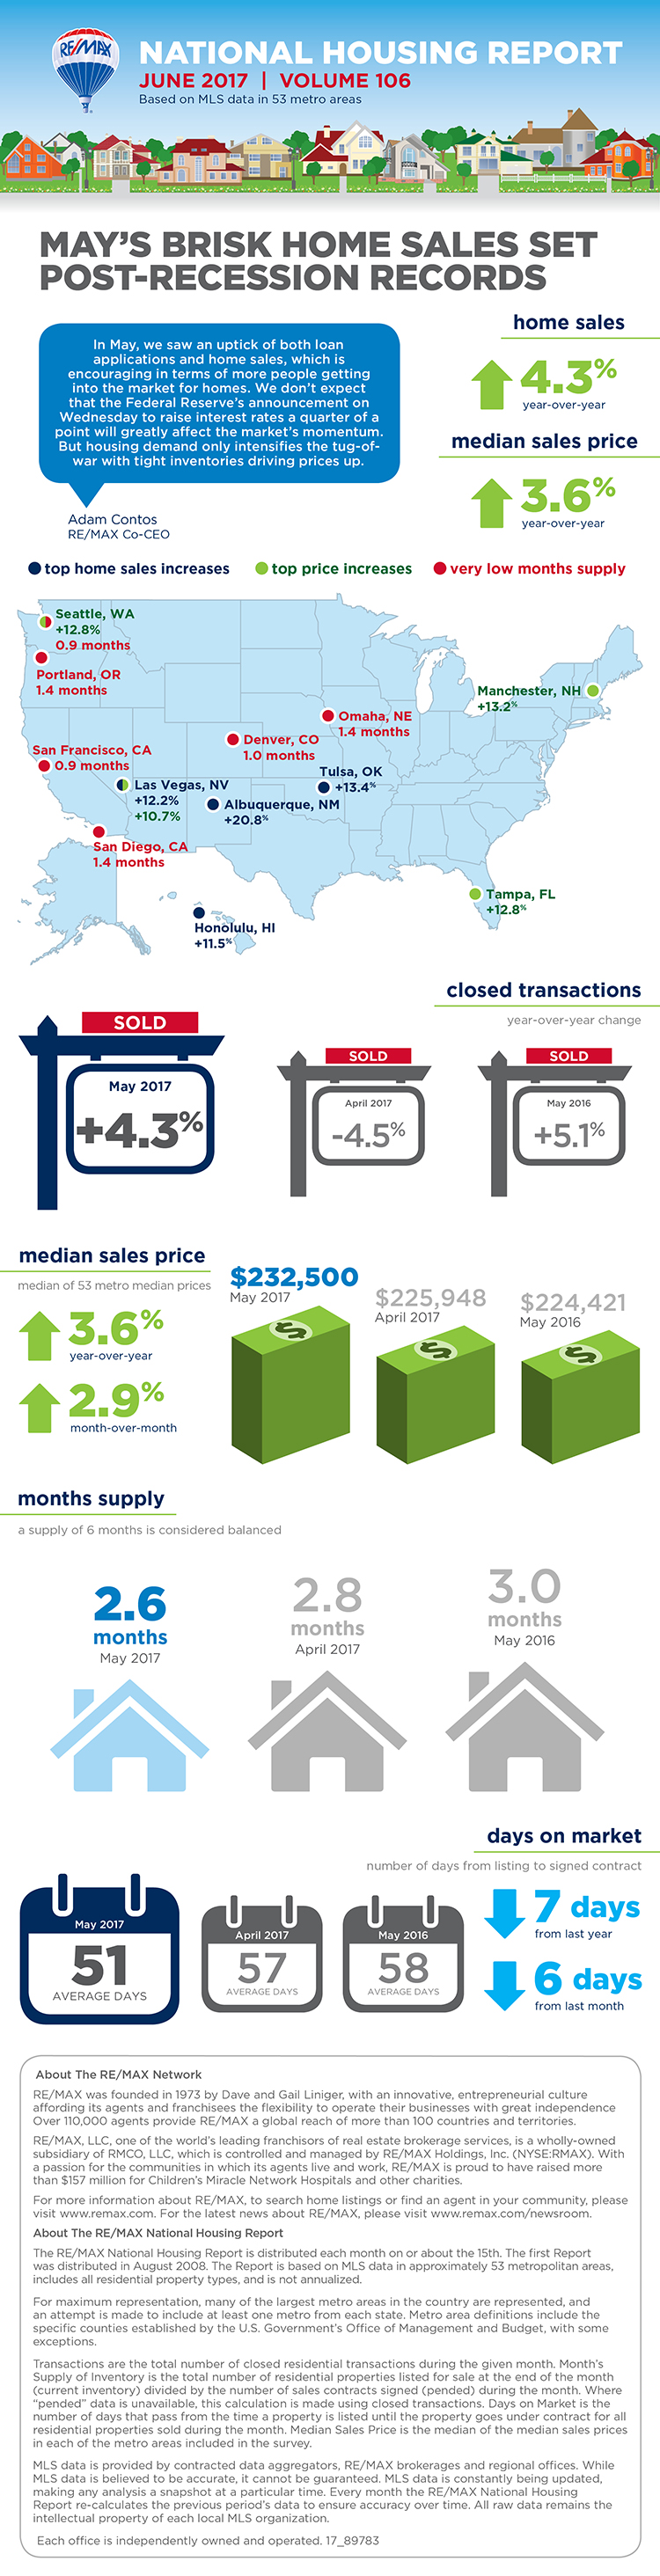
June Housing Report
After a brief dip in April home sales, the U.S. housing market returned to seasonally high sales in May, increasing 20.6% from the previous month and 4.3% from May 2016, according to the RE/MAX National Housing Report released today. In fact, it was the strongest May...
May Housing Report
The brisk start to the 2017 home-selling season slowed down in April with home sales dropping 4.1% below March and 4.5% below the previous April, according to this month’s RE/MAX National Housing Report. Find the complete report here.
April Housing Report
March launched the home-buying season with post-recession records for increasing home sales and prices and decreasing inventory, according to this month’s RE/MAX National Housing Report that surveys 53 metro areas. Find the complete report here.
March Housing Report
February home prices reached a new high as steady demand combined with record low inventory drove prices up, according to this month’s RE/MAX National Housing Report that surveys 53 metro areas. Find the complete report here.
February Housing Report
With the tug-of-war between rising home sales and shrinking inventory intensifying, January set records for the RE/MAX National Housing Report. Last month topped all other Januarys in the report’s nine-year history with the most sales, highest sales price and fewest...

January Housing Report
Capped off by a strong December, 2016 was the best year for U.S. home sales since the recession, according to the January 2017 RE/MAX National Housing Report. Home sales in 2016 were the highest in the housing report’s eight-year history, topping the sales of 2015,...
How can we help?
Contact us for a whole new level of service. Email or call for assistance.
661-945-9461
RE/MAX Agents DO MORE from FOR SALE to SOLD!